


Get the complete picture of malware processes in the updated Advanced details of the process. Improve your productivity with a new feature – examine events and incidents in the timeline, use simple navigation and get a wealth of data.
Advanced details of the process– a new step into deep analysis
When carrying out a dynamic analysis of a sample, it’s a must to investigate the inside of running processes. The goal is to examine how a process relates to the system state and other artifacts collected from the system.
To do this valuable step, you can use ANY.RUN’s Advanced details of the process. It provides a way to monitor registry, file system, network, and process activity.
But bigger is better – ANY.RUN remastered the approach to the process analysis and decided to add more functionality so that you can analyze malware properly. Here are all advantages that we have prepared for you:
- work faster with simple navigation
- get the wider picture of the process timeline feature
- access data easily
- analyze new information on process synchronization
With this updated feature, you can carry out deep malware analysis and investigate events and incidents within a process. Let’s talk more about these changes.
Simplified navigation or how to speed up your productivity
Do you want to quickly switch between processes in the task and not lose any data? Done. We understand that going back and forth between the windows is not a definition of speed at all. So if you need to choose the child process or investigate a completely different branch of the process tree – just click on it without leaving advanced details.
Compare whatever you want smoothly and get all information you need. ANY.RUN is always committed to improving the interface, so our users can enjoy malware analysis on the service.
You can use the advanced details of the process to improve your productivity easily:
- Read the basic process information like the verdict, PID, etc.
- Investigate and copy the whole command line data.
- Switch between processes in the process tree conveniently.
- Choose the indicators you need from redesigned groups. All incidents are divided according to their statuses: Danger, Warning, and Other. Click on the one you want to bring up Behavior activities.
- Use timelines. The first one displays the chronology of when the process started and finished its execution within a task. And the second timeline shows incidents in the chosen process.
- Filter the incidents. Choose Deep to see all incidents and Group to filter out only the important ones.
- Choose the incident you need with pagination.

These modifications allow users to analyze data on the fly, so we believe it’s a real game-changer for your investigation.
A time machine for malware analysis: process timeline feature
Cybersecurity specialists analyze a malware’s process to the core. And they should know when and what events happened within this process. But how do you know it for sure? Guessing or calculating to find the necessary event at the exact time is devastating. Scrolling through thousands of events takes a lot of time. It sounds like a real challenge.
And ANY.RUN couldn’t leave it as it is. That is why we introduce a time machine for your convenience – the timeline feature.
No endless scrolling and guessing anymore. We have solved both issues – you see the activity on the timeline, and you don’t have to guess when the incidents happened. Then, you can choose the necessary process period, and here you are: the events you need are displayed immediately, and the frustrating scrolling can be left for good.
For example, the Socelars starts its execution with the 29c16caf3d9bbbd6437a70390a0212d1.exe process. To get detailed data, choose More Info.
The Socelar’s process has two timelines:
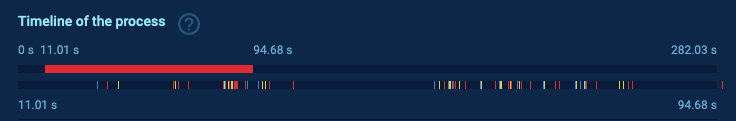
1.The first timeline shows process execution regarding the entire task.
It gives us the scope of the process’s place in this sample.
282,03 sec is the time of the whole task. And the highlighted area here is 29c16caf3d9bbbd6437a70390a0212d1.exe. Simply looking at this, we get that the process was active during 11,01-94.68 sec.
2.The second timeline displays incident performance during the process execution.
We can choose the packed spots and investigate incidents that happen at a specific time.
We can notice a malicious group of incidents. Let’s see what activities the process has done at this time. Choose a period on the timeline, click on Deep view, and here we are:

If you go down, you will know when the process took place on the timeline at the same period.
Now we have data on all incidents that happened, and we can follow the process activity to the msec. That information wasn’t easily available before. And we are proud to expand your analysis by providing truly advanced details in a fast and convenient form.
See the whole picture at once
Before this feature, you used to spend a significant amount of time only looking for the significant data that the process hides. But right now, you get the whole picture with one click only.
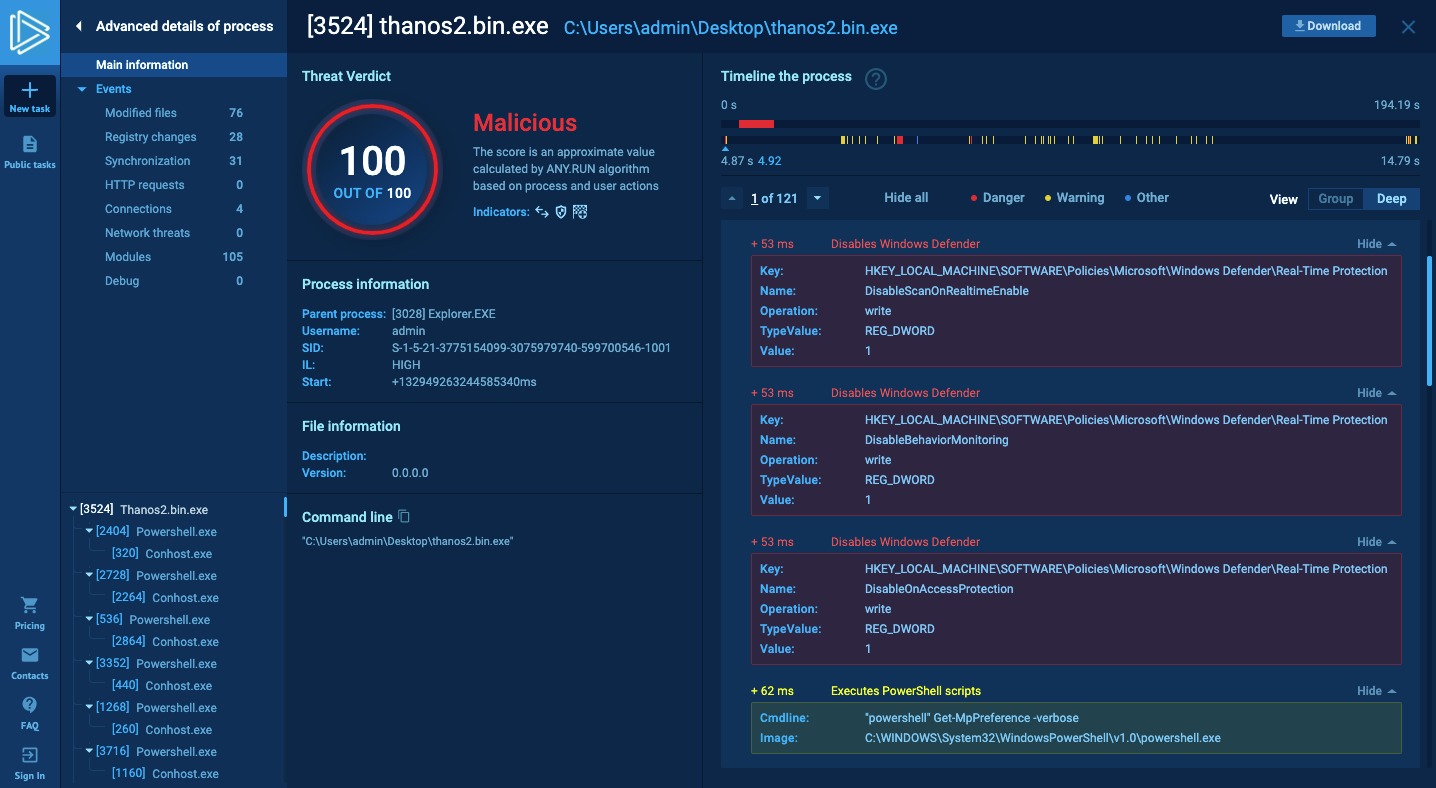
For example, this Thanos sample has many activities at 53 msec. We can choose that period of time to investigate more with one move. And that’s all, no more cats in the bag. The incidents that were hidden before now show us a real story.
So, this way, we understand that there are 4 events. The first three critical events show us that Windows Defender and its modules are disabled. The Warning event that we see below tells about getting scripts for scanning and the Windows Defender’s update. Just a click – and you can connect these events into one picture of crooks’ intentions.
Synchronization
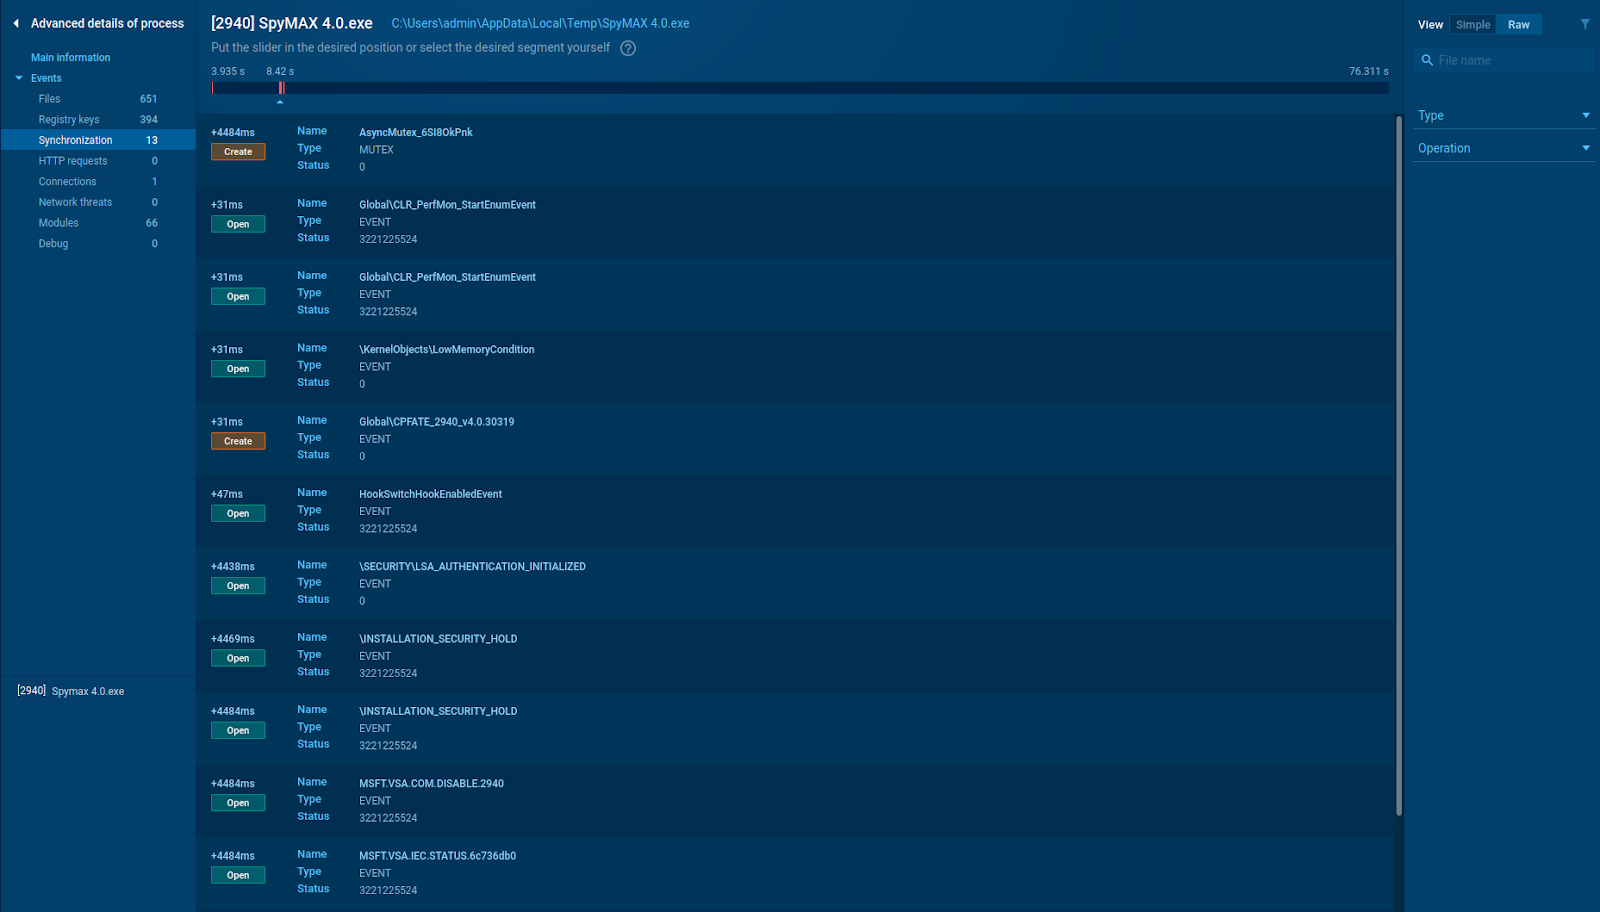
ANY.RUN is ready to show you a new page in the Advanced details of the process – Synchronization. This section displays data on mutexes that will expand your analysis significantly.
One of the methods that malware uses to bypass detection is achieved by using mutexes.
Malware, in some cases, uses mutex objects to synchronize the communication between its components and avoid execution on the same system more than once. These mutexes have specific names, and typically a malware detection system can look for those known names and spot the presence of malware.
If you open the AsyncRAT example, you can investigate various mutex objects on the Synchronization page like AsyncMutex_6SI8OkPnk is created not to let malware relaunch itself.
Get a wealth of data on the process
Advanced details have multiple layers that create a real mind palace. We have seen the Main information, and it’s time to guide you through Events.
Each tab is like going down a rabbit hole. You can investigate the process from inside and out, look at it from different angles like:
- Modified files / Files in a raw view
- Registry changes / Registry keys
- Synchronization
- HTTP Requests
- Connections
- Network threats
- Modules
- Debug
Use the timeline feature on all tabs as well. All events are distributed according to their time of execution.
The best way to see the wellness of these updates is to put them into practice. Let’s research one Sodinokibi ransomware sample together.
It’s 1.27 sec from the start of the analysis, and we have already noticed interesting activity. The G.L.O.R.I.A.exe process immediately gets a malicious verdict. Let’s find out what’s going on there and take a 5-step journey into this process.

Step 1. Modified files
The process constantly writes and changes files, and the timeline shows these events perfectly. Moreover, color indication shows the busiest time for ransomware. The sample creates numerous events, and the colors on the timeline reflect this frequency.
The analysts easily understand at what time exactly happened the considerable amount of events by bright areas and when there was lower activity by dark spots. The timeline clearly displays it.
Filters for your convenience search are also available. Look for the event you want by name, hash, type, or other parameters.
The new data structure allows scaling the process without losing important information. The number of tabs changes depending on the process content. And we plan to add even more information to expand your perspective considerably.
Choose a simple or raw view. Raw opens Files and allows seeing a large amount of data concerning the analyzed process. There are additional sections like Operation, Access, Created, and others in Modified files.
Let’s say that we need to see the list of deleted files from the start of the process. Choose a special option: Operation and Delete.
Step 2. Registry changes
Here are all events that happen in the OS’s registry during the G.L.O.R.I.A.exe process. It reads and records all system registry keys to collect information on the infected OS, and more information is displayed in the Raw view.
Step 3. Synchronization
This is a new ANY.RUN’s section. It contains objects for the synchronization of applications. For example, it creates a unique mutex name, and it doesn’t let the malicious program launch one more time.
Step 4. Connections
We can see that G.L.O.R.I.A.exe communicated with the C&C server on this page. So, feel free to grab data like IP address, port, and location.
Step 5. Modules
G.L.O.R.I.A.exe prepared something for us: kernel32.dll library allows applications to use basic Win32 API such as process creation and memory management.
We got much more information in a flash with upgraded Advanced details of the process. Now it’s much easier to perform dynamic analysis of malicious objects. We can filter significant events according to the execution time with the timeline feature. It saves time and shows essential data for clear process understanding.
Conclusion
We tend to keep our promise – ANY.RUN said more features, and you get them. The enhanced feature of Advanced details of the process is a step forward in deep malware analysis. Our users get more data with no effort at all.
Investigate samples to the fullest, and let us know what you think about the new feature in the comments.
5 comments


Thank you, hope you’ll enjoy the update!
Oh, nice. I’ve just restarted a task with new features. Like ?
Thanks for your support?
agree with Dan, it looks profitable
thanks anyrun!
I was just seeking this information for some time.